How To View Analytics For a Particular Period
Every Crate report can be narrowed to exactly the stretch of time you care about — last 7 days, this year, or a custom range you type in. Here's how the period picker works.
Numbers only mean something against a period. Crate puts the same period picker on every report so you can ask "how did this fortnight go?" without learning a new control each time.
The presets
The chips cover the windows you reach for most:
- 7d — the last seven days, for a quick pulse check.
- 30d — the last month (this is the default when you open a report).
- 90d — the last quarter, good for spotting trends.
- 12m — the last twelve months.
- YTD — the year so far, from 1 January to today.
Click any one and the entire report — tiles, charts and lists — re-queries for that window at once.
A custom range
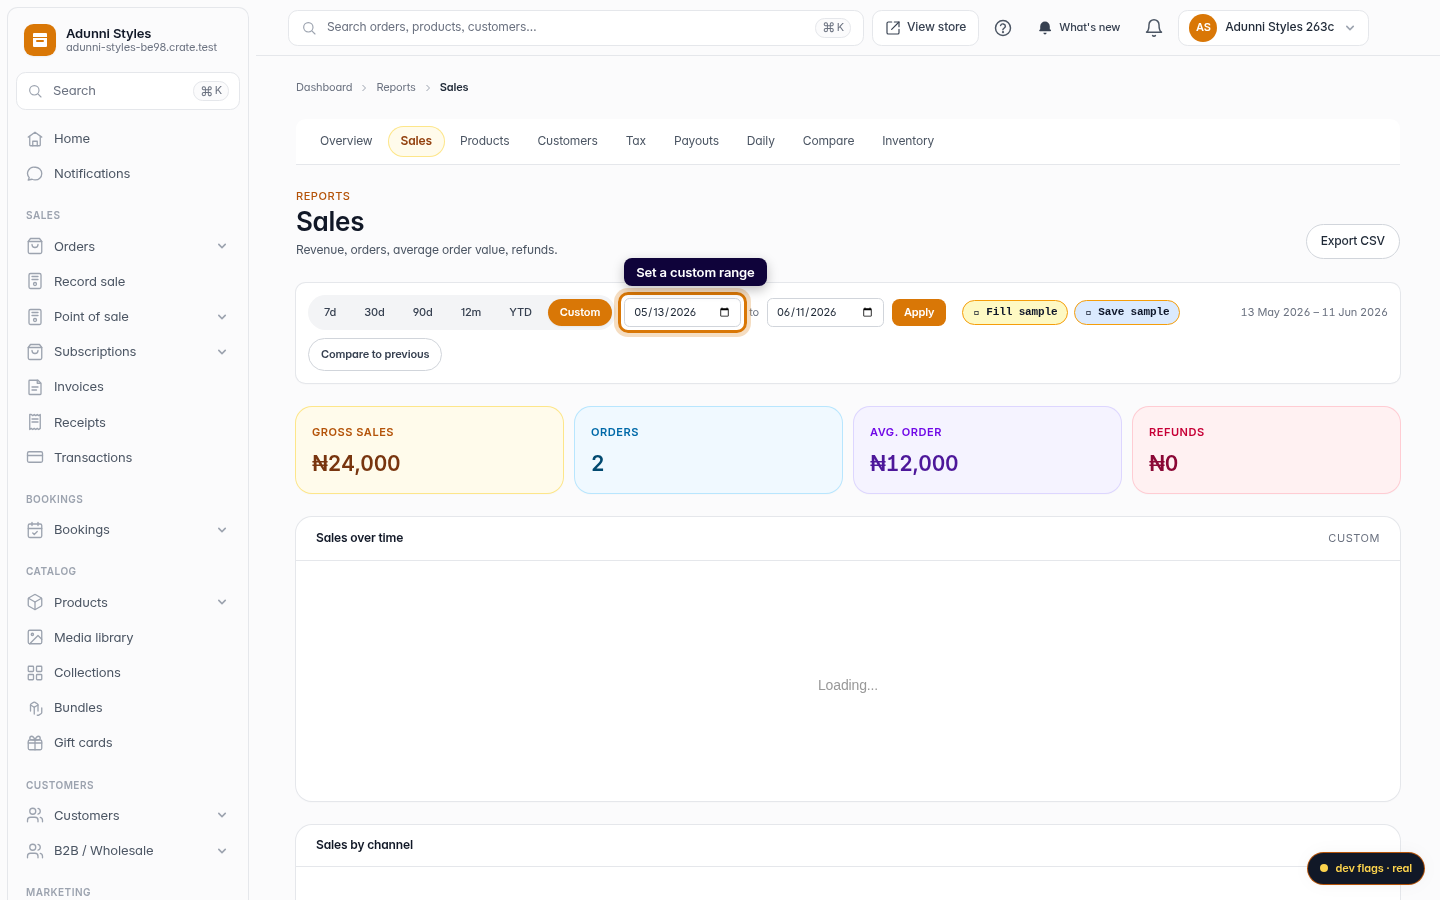
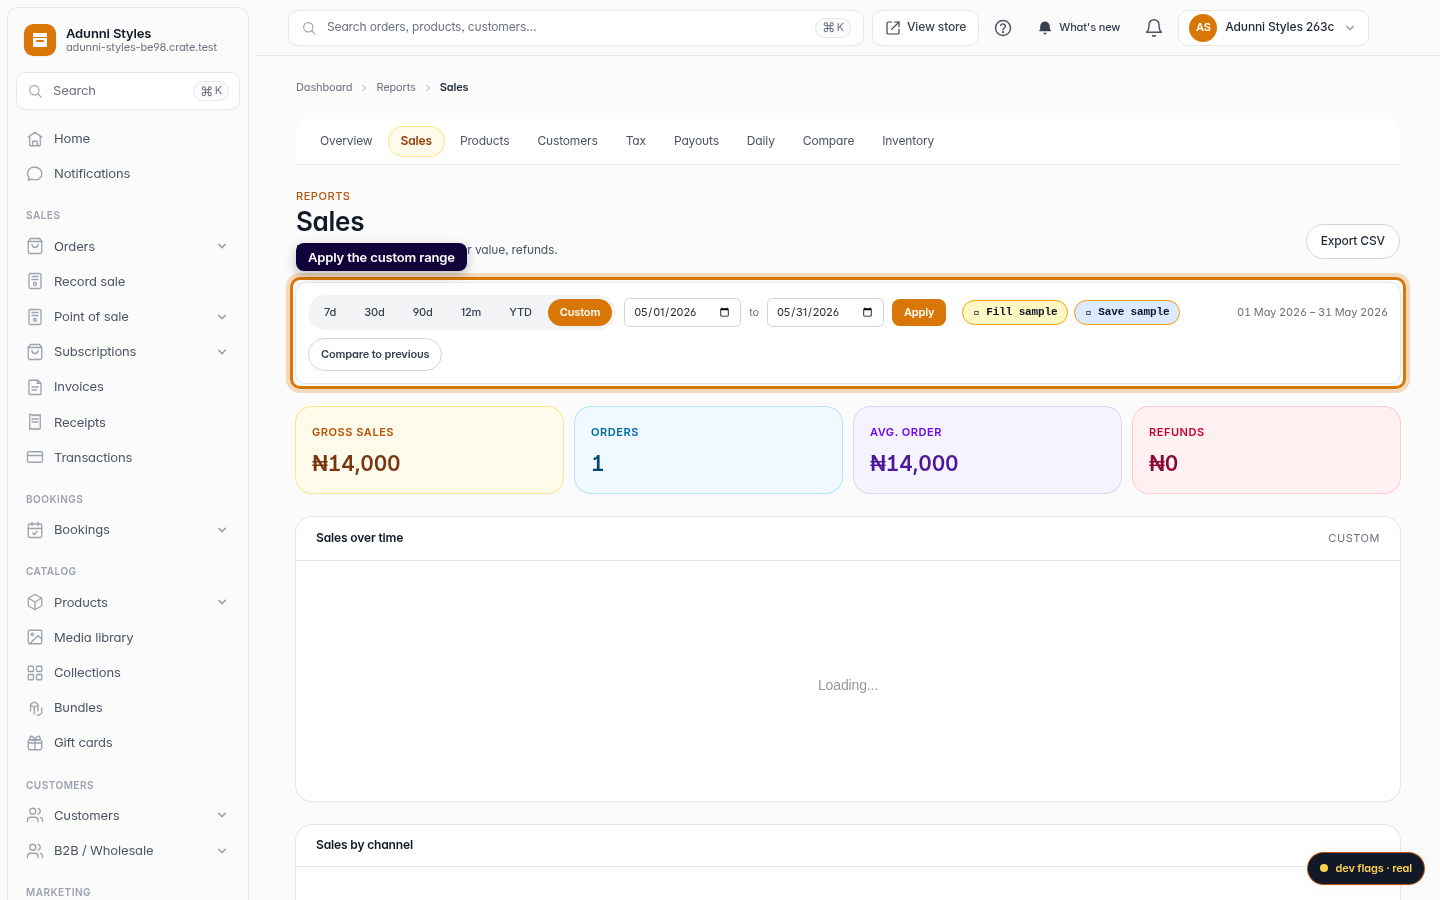
When a preset doesn't fit — say you want a single campaign week or a specific month — click Custom. Two date fields appear: set the from and to dates and click Apply. The report reloads for exactly those days.
Tip: Your period choice lives in the page's address. Bookmark a report on a custom range, or paste the link to a teammate, and you'll both land on the same numbers.
Once you've got a period set, you can take it further: turn on Compare to previous to put it beside the period before it (see Sales Analytics), or use the dedicated Compare periods view to pit any two ranges against each other.
-
1
Open a report
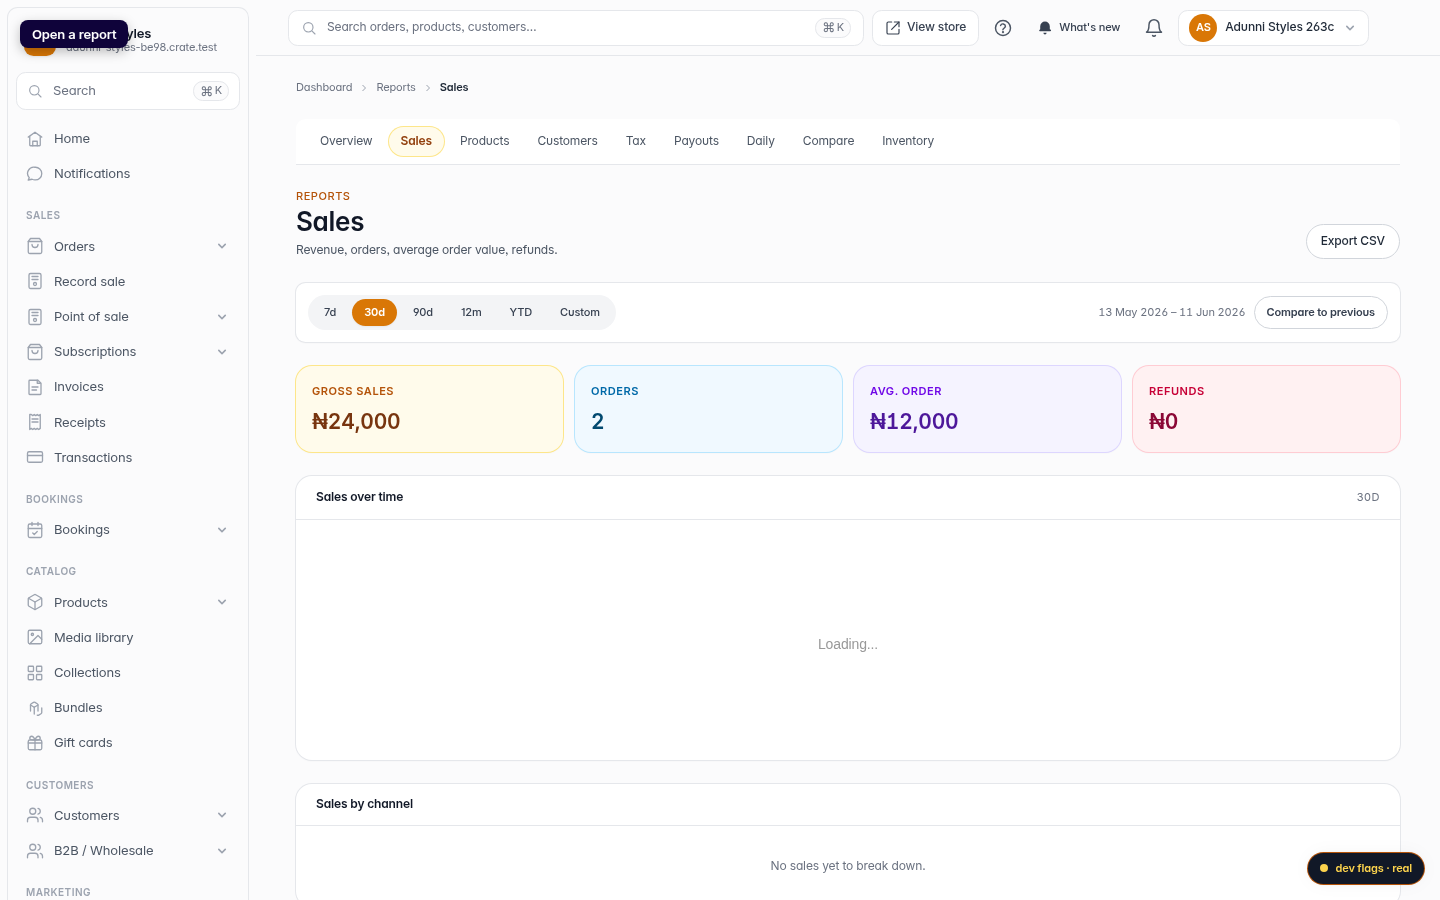
From your Crate dashboard, open Reports and choose any report — Sales, Products or Customers. The period picker works the same on all of them.
Web -
2
Find the period chips
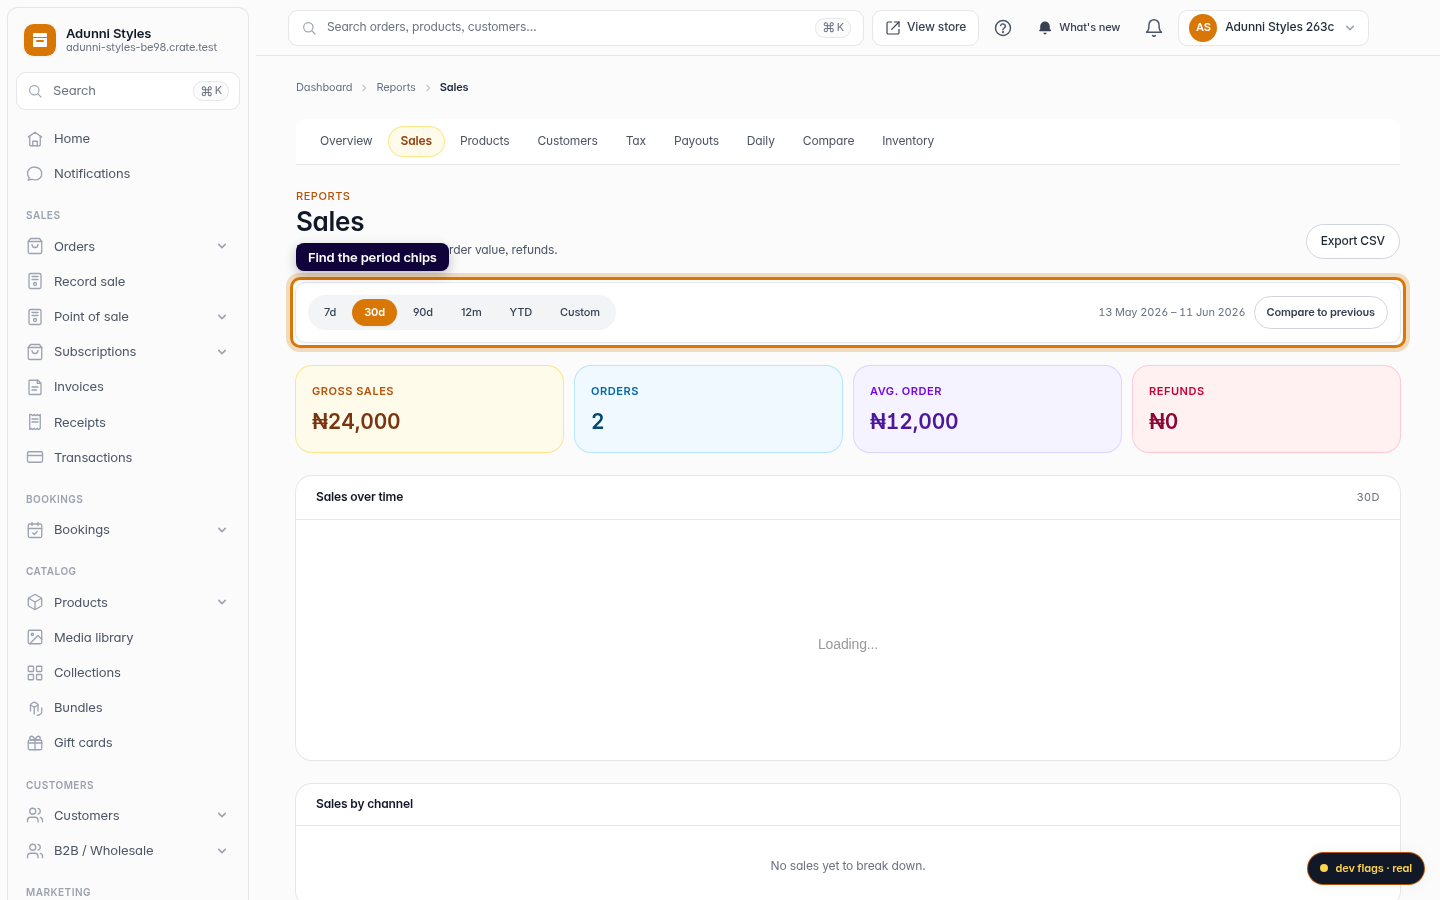
Just under the page title you'll see a row of period chips — 7d, 30d, 90d, 12m, YTD and Custom — with the active range shown beside them.
Web -
3
Pick a preset
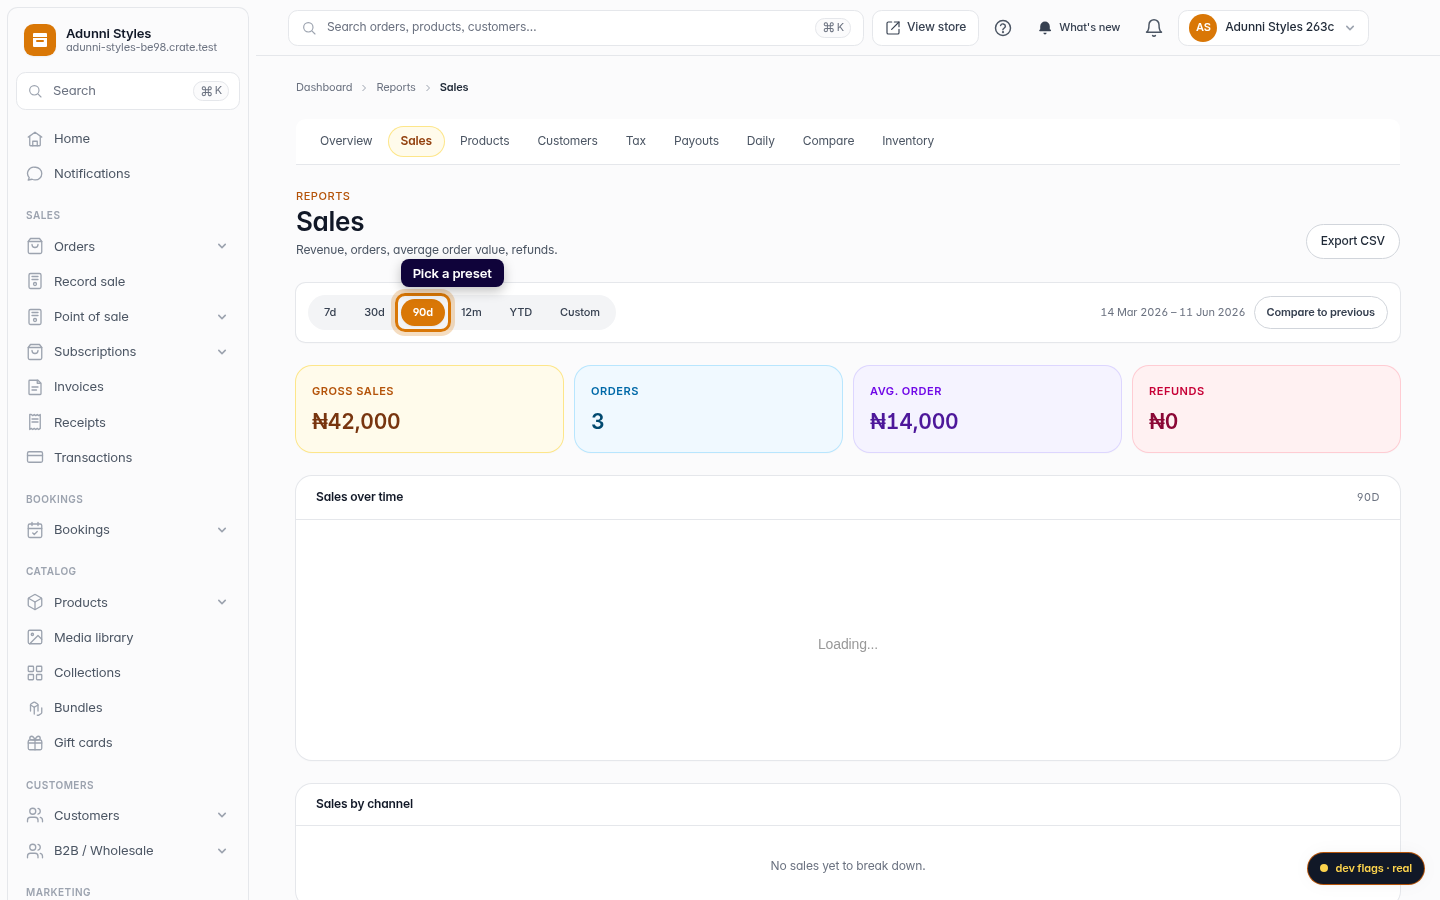
Click any preset to re-query the whole report for that window. YTD covers the year so far; 90d the last quarter. The numbers update immediately.
Web -
4
Set a custom range
For an exact window, click Custom to reveal two date fields. Pick a from and a to date.
Web -
5
Apply
Click Apply. The report reloads for precisely those dates, and the range label confirms what you're looking at.
Web